
CASE STUDY
Data Transformation – A Customer Success Story
Short Par 4 was born out of a love for fashion, a passion for golf, and the desire to save money. It is a leading subscription-based golf apparel and accessories company. Customers choose between different memberships levels and receive a box of personalized apparel and accessories each month. Short Par 4 stylists are avid golfers themselves, which makes the products and experience highly relevant and appealing to its customer base.

The Opportunity
For the past several quarters, Short Par 4 has seen stellar growth with a rapid, significant increase in their subscriber base across all geographies, and during all seasons, in the United Sates. With this growth in mind, the company wanted to take a moment to better understand their customers. This knowledge would be used to better orient their subscriber mix toward segments with which they could maintain long-term relationships.
Development of a sustainability strategy required Short Par 4 to know their customers and audiences beyond contact information and transactions. This was a great opportunity to enrich first-party behavioral data with third party contextual data to find insights about their subscriber base strategy.
Data, Transformation, and Stack
Brainlabs and IntuitioLab LCC worked to secure the collection of three primary data sources to perform the analysis covering subscribers, buyers, and mobile app users. The subscription data for last 36 months was extracted out of Recharge. Buyers for last 12 months were extracted out of Shopify. And the app data was extracted as a CSV file. All three data sets were hosted in AWS S3. Python scripts on AWS EC2 were used to deduplicate and cleanse data to generate the requested file for third party data augmentation. This compute environment was also used to analyze customers, their transactions, and build RFM segments.
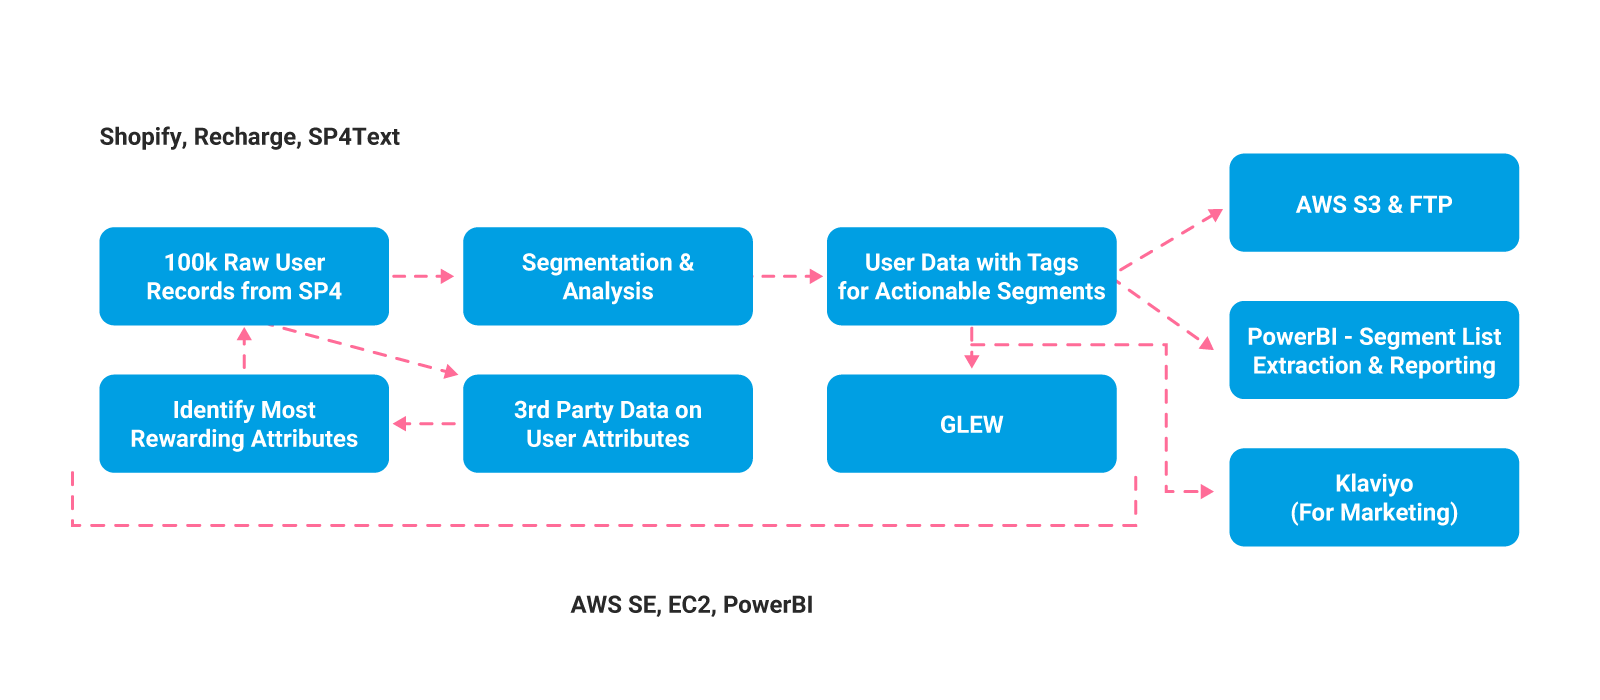
The data exchange with third-party data vendor was completed via CSV file, and the augmented file was hosted back in S3. The EC2 compute engine was used for unsupervised clustering on third party data. The final augmented file, the RFM segments, and the unsupervised clustering output, was uploaded into PowerBI, Klaviyo for emailing, and in Glew.io, for online retargeting and personalization.
Analytics Outcomes Delivered
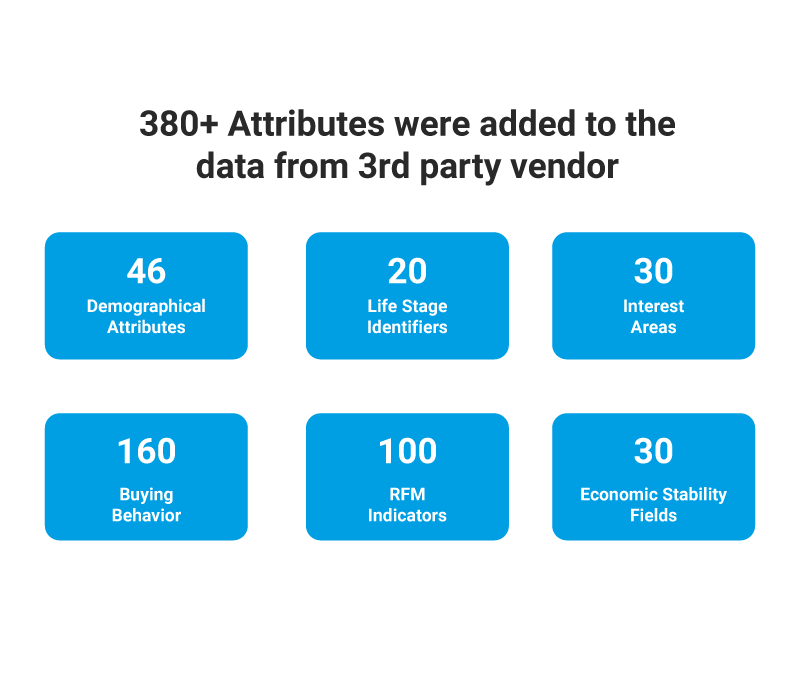
As part of third party data augmentation, Short Par 4 was provided with 380+ additional attributes to enhance the understanding of existing subscribers and buyers. The augmentation allowed the company to better understand a customer’s typical demographic profile, life stage, and personal interests.
This information proved useful for Short Par 4, allowing them to fine-tune marketing content and messaging strategy. Further, the company learned the key economic indicators and shopping behavior of their customers, which will help align products, sales, and pricing strategy.
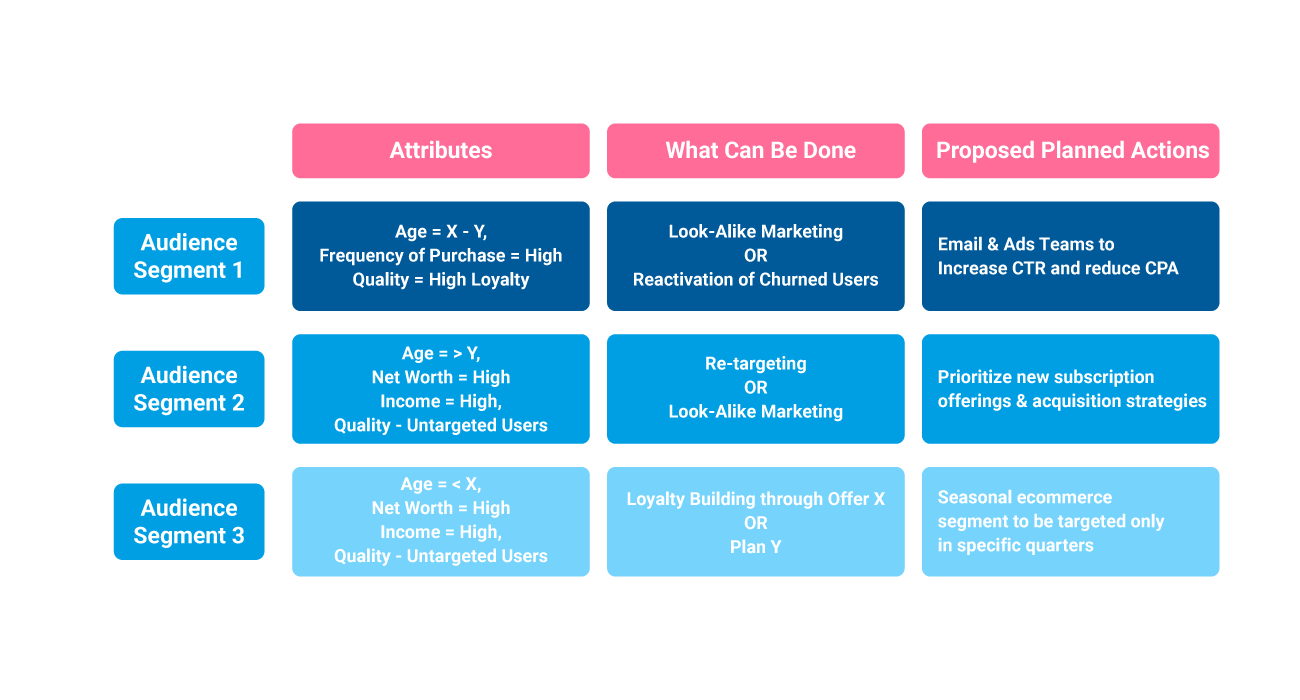
The cluster profiles defined their uniqueness and potential marketing action, which can be personalized for each cluster. Each cluster profile explained the typical demographic, interest areas, economic purchase power, and shopping behavior. These clusters were created using Machine Learning with transaction and third-party data. They included profiles to explain the typical demographic, interest areas, economic purchase power, and shopping behavior. Eventually, they were grouped into the three core audience segments that enabled teams including Creative/Content and the Agency (IntuitioLabs) to use in various marketing programs for audience creation and targeting.
Business Insights Delivered
A Microsoft PowerBI dashboard was created to understand key business metrics to further aid decision-making, and contextualize recommendations.
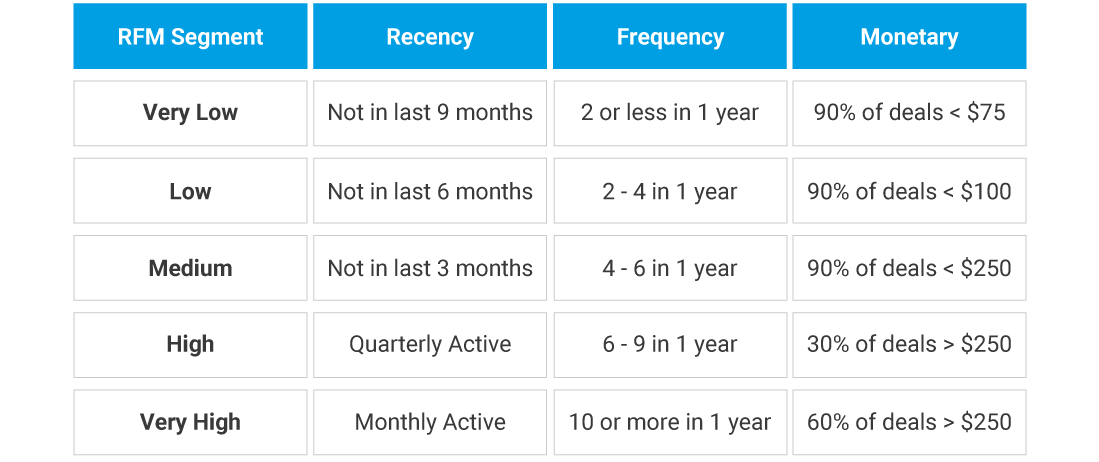
The table above explains how customer segments were defined. The chart below breaks downs the customers into VIPs, or how much they exhibit high loyalty and profitability.
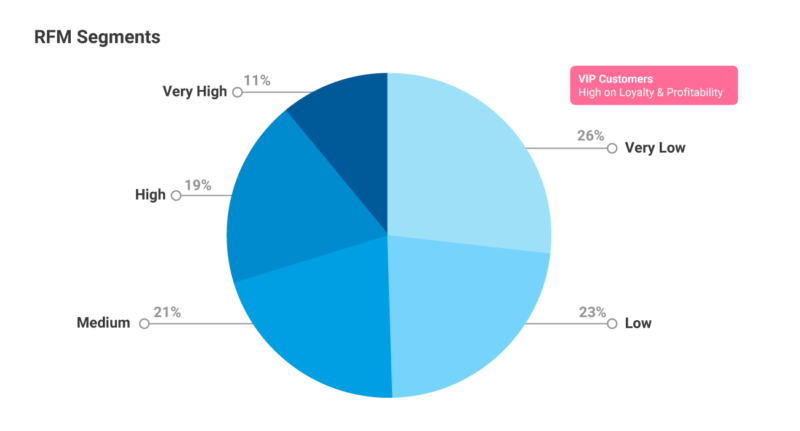
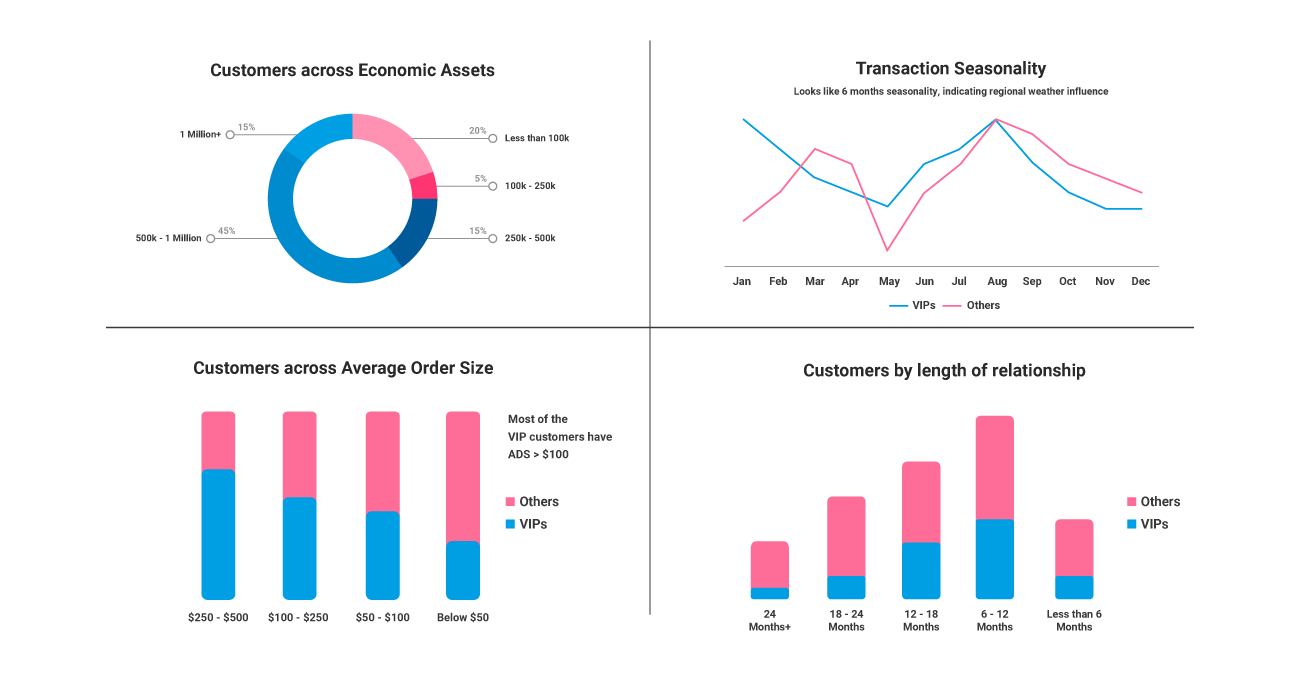
This data was analyzed and sliced to produce additional views and generate the insights into when VIPs are most likely to shop and purchase. The following graphs, which are part of the Power BI dashboard, helped the client understand these VIP customers even more by separating them into different metrics including relationship length, order size, seasonality, and economic profile.
Marketing Transformation At Short PAR 4
Mind Shift
-
- Short Par 4, and specifically their marketing department, has now adopted a data-first mentality. Business stakeholders embrace data over intuition and emotion.
- The work delivered has unlocked interesting connections that prove non-analytics personnel at Short Par 4 can make sound marketing decisions, changing their culture forever.
Media buying based on three audience segments
-
- Tested three audience segments lookalikes in FB, and returned an improvement of 17% on CAC.
- Short Par 4’s churn from paid advertising has halved since they started to leverage the data to inform how to target and what to offer.
Marketing/Campaigns
-
- Messaging: Focus more on “Convenience and Style” over “Value,” in which “Value” meant discounted prices. With updated messaging, “Value” now relates to the value delivered in the box. This focuses on the cost savings each subscriber receives before any upfront discounting. In short, the COGS to Discount/Revenue ratio has materially improved, almost by 20%.
- Instead of discounting, Short Par 4 now highlights the total number of items in the first subscription box. Playing with COGS over price decrease to get people to sign on, which equates more to the discount buyer.
- Campaign Development: Highly targeted, personalized campaigns acquire more desirable customers pro-actively, rather than flowing with organic customer mix acquisition.